PET classification method
In the first step, we load the image and converts it to grayscale. The edge detection is then performed to allow the object to be located. A standard mode of operation using the Canny filter was used for the detection of the edge. After locating the object, we calculate the histogram for this part of the image. Analysis of the histogram consists in adding up first hundred, and next hundred last elements of the histogram. Considering the fact that PET is transparent material but the background of images it is black (similarly to the transmission belt in the sorting plant) we are comparing received values of sums. For PET the value of the first sum will be greater, while for other non-transparent materials the second sum will be larger (Fig. 1).
Finally, on this basis, the decision is made to classify the object as PET or non-PET.
-
Algorithm:
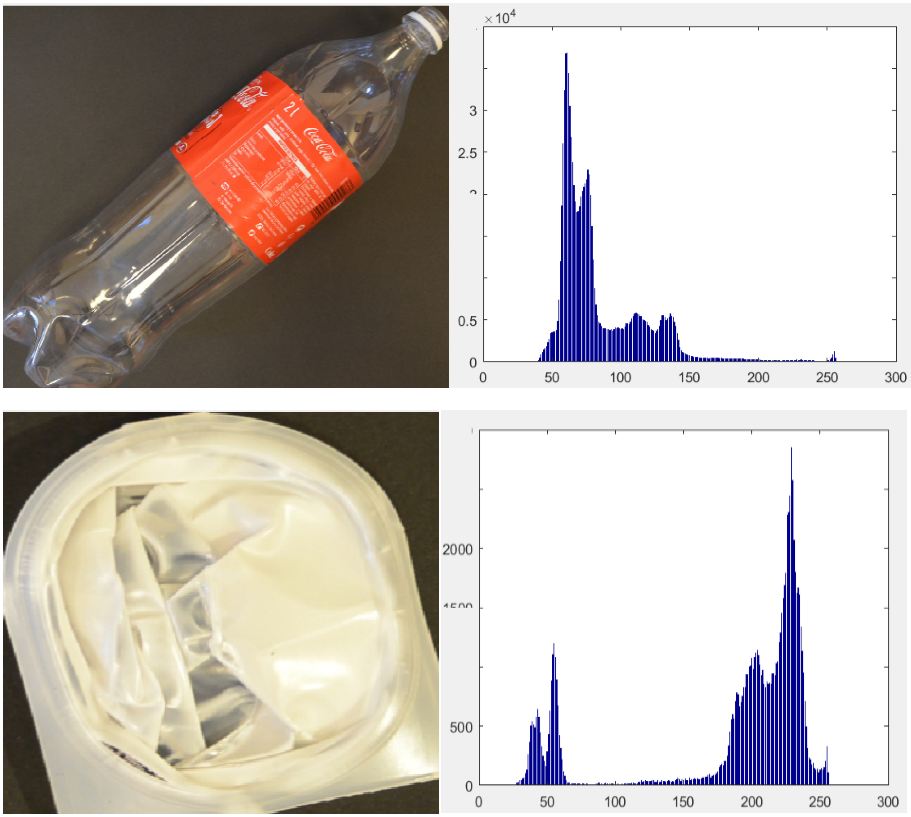 Fig.1. Comparison of histograms
Experiment
The experiment was carried for our database WaDaBa . We used ten sets of data with 200 pictures each that means that we used two thousand images. Table presents results of experiment. These results have preliminary character for developing advanced waste selection techniques based on computer vision techniques.
Tab.1. Results of experiment
| Name of set | No. of images | Recogn. rate [\%] | FAR [\%] | FRR [\%] |
| Set A | 200 | 92.0 | 0 | 8.0 |
| Set B | 200 | 92,5 | 7.0 | 0.5 |
| Set C | 200 | 61,0 | 25.0 | 14 |
| Set D | 200 | 74,0 | 25.0 | 1.0 |
| Set E | 200 | 54,0 | 46.0 | 0 |
| Set F | 200 | 88,5 | 11,5 | 0 |
| Set G | 200 | 51,5 | 48,5 | 0 |
| Set H | 200 | 57,0 | 42.0 | 1.0 |
| Set I | 200 | 88,0 | 11.0 | 1.0 |
| Set J | 200 | 80,0 | 14.0 | 6.0 |
| Set K | 200 | 94,0 | 6.0 | 0 |
| Average | 75,68 | 21,45 | 2,86 |
The comparison to other methods using database WaDaBa
Send us information about your method - according to information in the table below. email: januszb(at)icis.pcz.pl| No. | Name | RR [%] | FAR [%] | FRR [%] | Reference |
| 1 | Histogram - our | 75.68 | 21.45 | 2.86 | [1] |
| 2 | Triple-histogram | 81.7 | 13.5 | 4.8 | [2] |
| 3 | Your | ? | - | - | [3] |
References
- J. Bobulski, J. Piątkowski, PET waste classificationation method and Plastic Waste DataBase WaDaBa, Conference Proc. IP&C 2018, Advances in Intelligent Systems and Computing, vol. 681, Springer Verlag, 2018, pp.57-64. PDF.
- Bobulski J., Kubanek M.: The triple histogram method for waste classification, 18TH International Conference of Numerical Analysis And Applied Mathematics ICNAAM 2019, 23-28 September 2019, Rhodes, Greece.
- Your